Reports & Dashboards
eTrack’s Dashboards are powerful and fast. Multiple reports can be viewed on one dashboard and laid out in any way you choose. They are displayed in real time reflecting the absolute latest time and budget updates.
eTrack’s built in Dashboard writer provides an easy to use wizard to clone and edit existing ones or build your own. You can add security and chose security groups and individuals to share them with.
Staff can toggle between charts and tables, change the date range of the data viewed, and view a graph as full screen. The table view is dynamic and you can group, sort and filter.
Here are some sample dashboards that come with eTrack.
Project Dashboard
The Project Dashboard is key to knowing the health of a project and if you need to drill down deeper to investigate. Flick through each project that you are responsible for with the confidence that the numbers are up to date in real time.
Stage Dashboard
Should a project show a problem the Project Manager can drill down and view each Stage Dashboard. This includes a trend over time showing actual verses forecast.
Project Group Dashboard
The Project Group dashboard gives a quick snapshot of the health of a group of projects.
Project groups may be current projects; the projects a manger is responsible for; those in a division or office or location; a client’s projects or those of a particular project type.
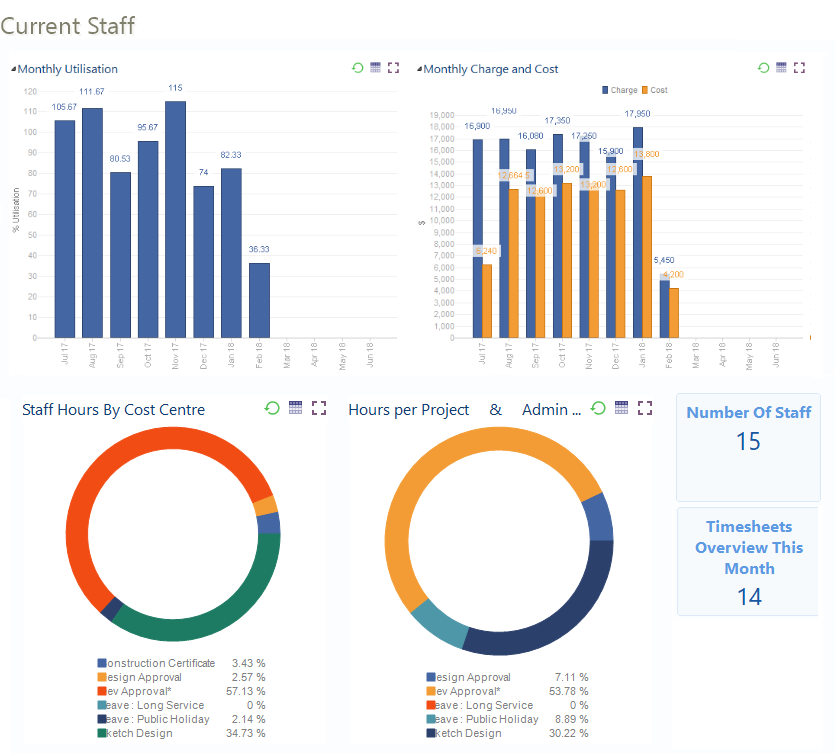
Staff Group Dashboard
To make a profit staff need to be efficient and knowing the productivity of each staff member will allow you to distribute work effectively and help staff via training. Knowing where staffs time goes helps you focus on which areas of your business need to be more efficient and seeing this trending over time helps with planning.
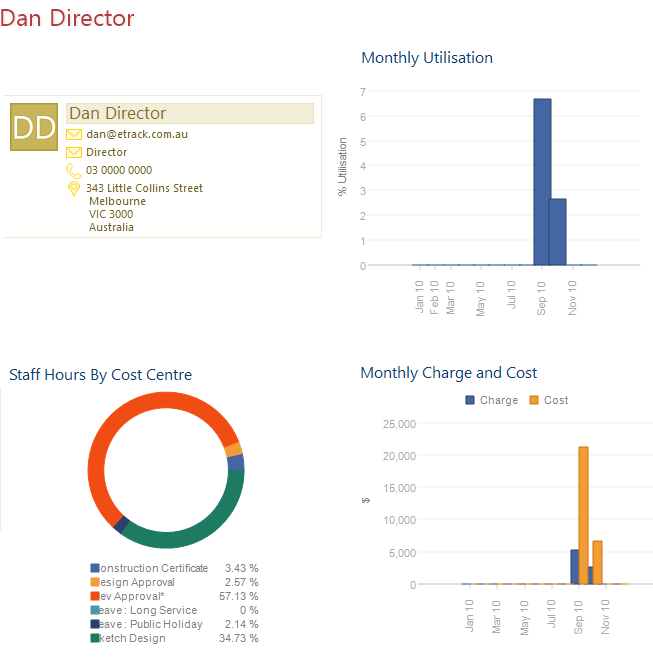
Staff Member
Knowing how each staff member is performing can help you with appraisals, personal development and working with them on their desires, efficiency and work allocations. The effect of training can be seen over time in trend reports.
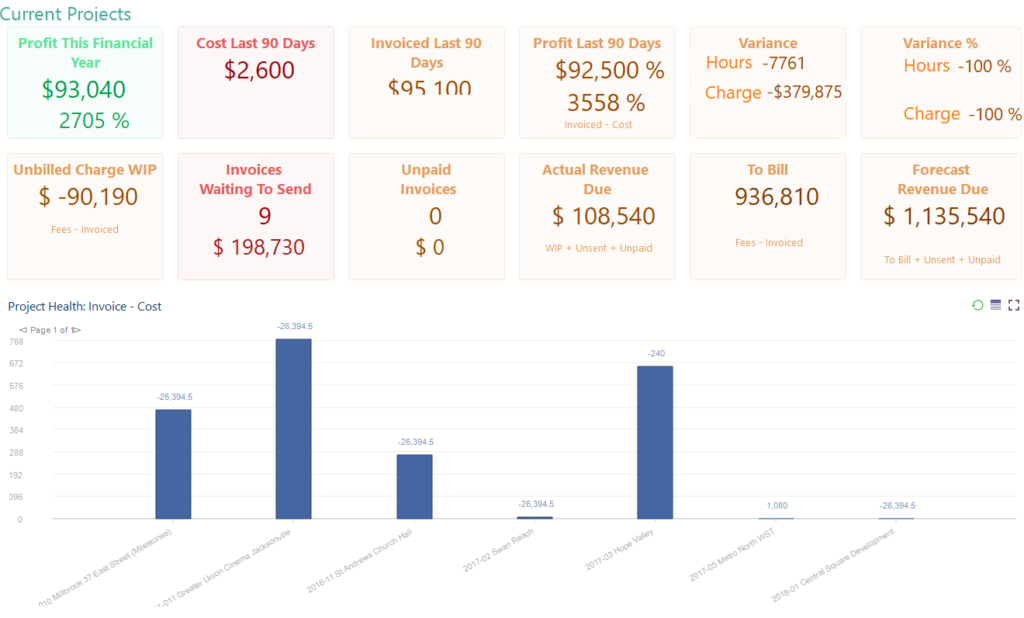
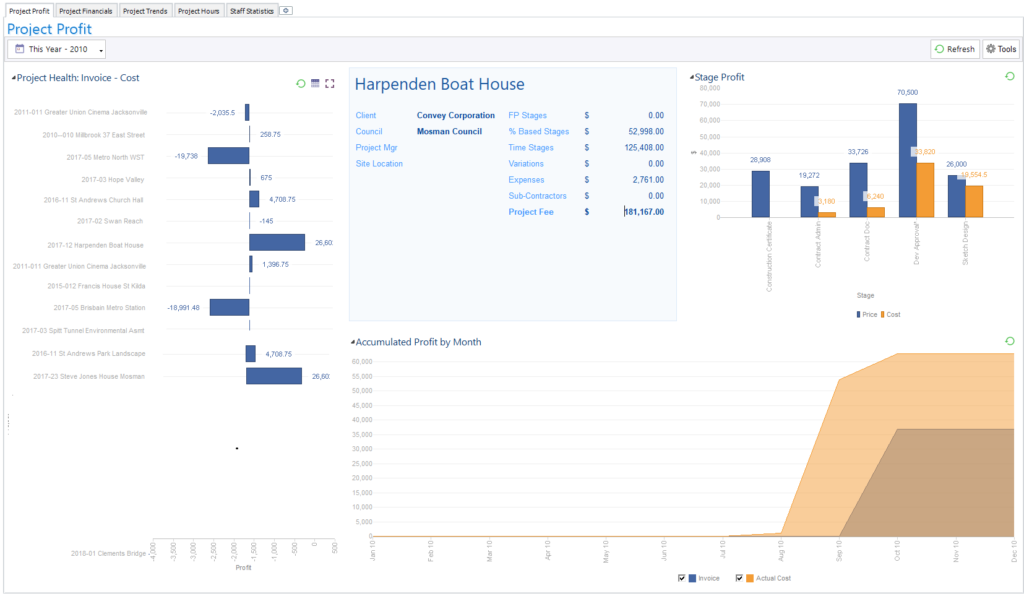
Project Profits
The project health graph on the left shows Invoiced–Cost as a pure and simple snapshot of the overall health of all your current projects. It might just be that you are behind in invoicing or that the project is losing money, either way it should be investigated.
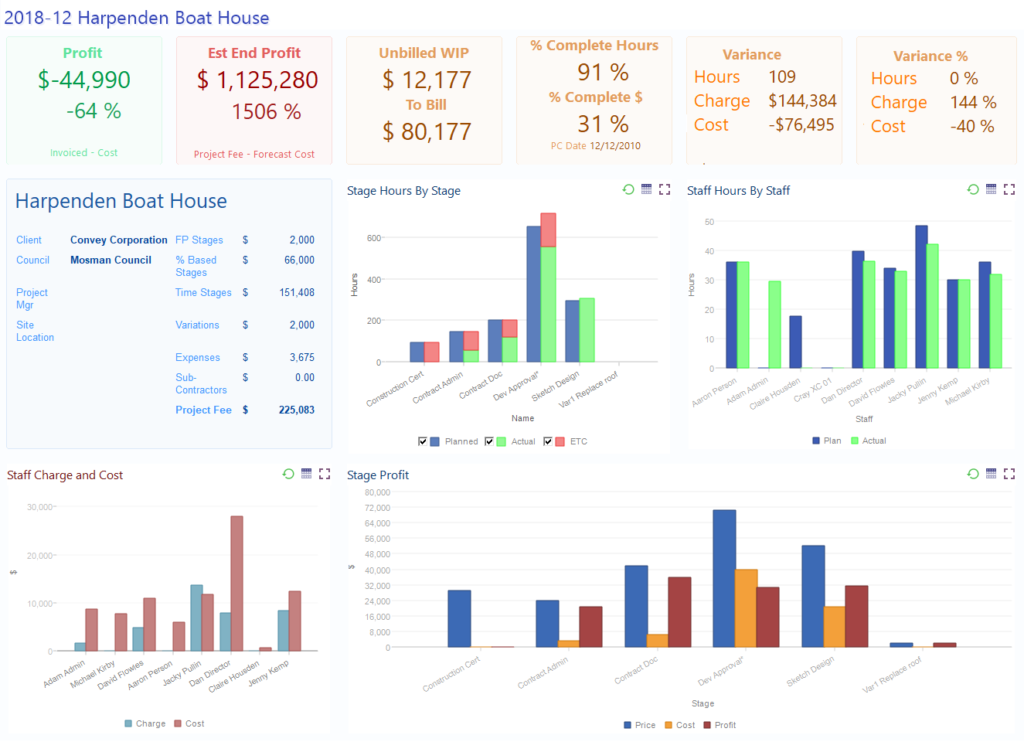
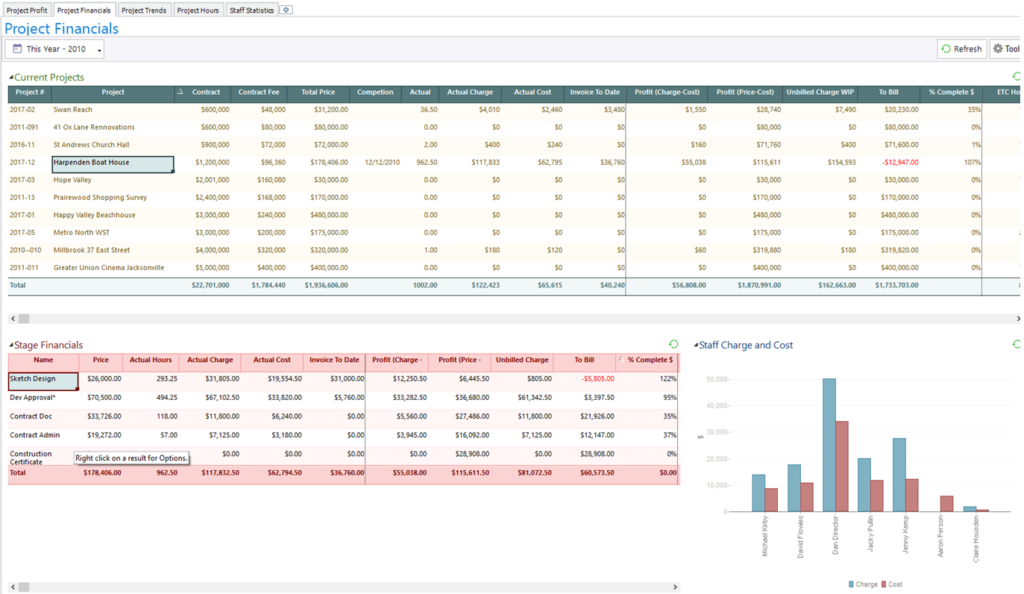
Project Financials
This really gets down to the detail of each project, showing hours, charge and cost, plus profit indicators such as Price-Cost. Selecting a project in the top table updates the stage details below and a graph showing charge verses cost of staff who have worked on the project.
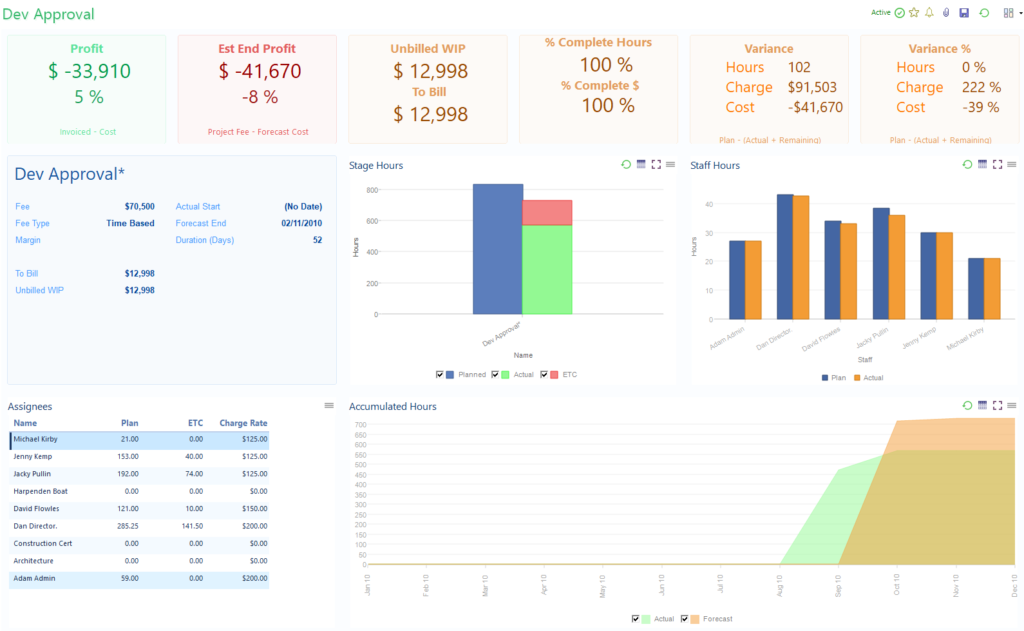
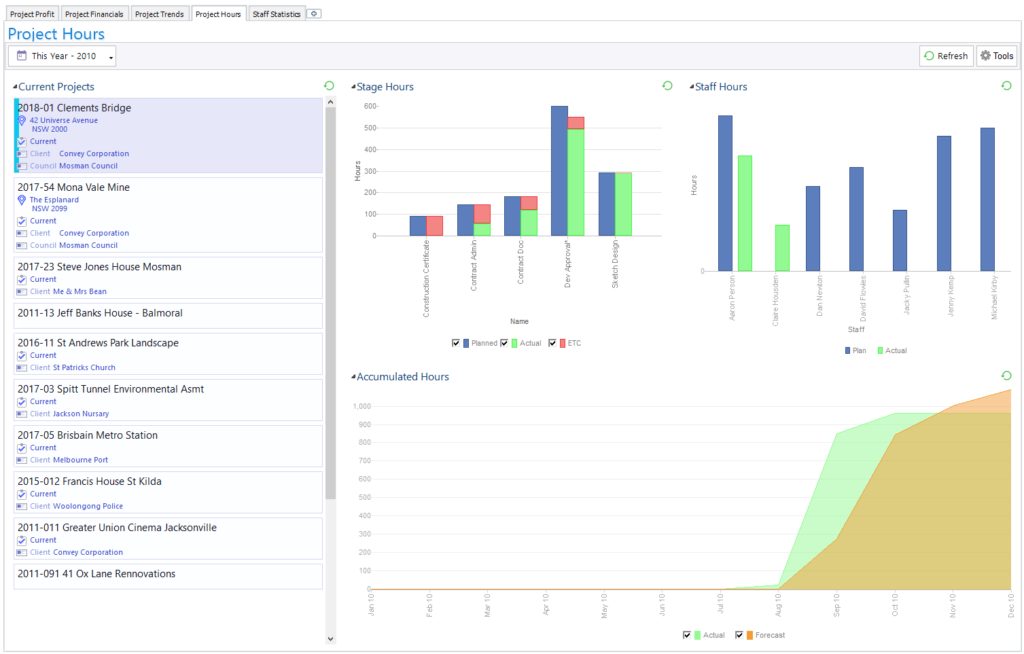
Project Hours
Selecting a Project card on the left will update Stage hours, Staff hours and a graph comparing accumulated forecast hours with actual hours. The Stage hours graph shows how actual hours from the timesheet (green) plus estimated hours to complete (red) compare with planned hours (blue).
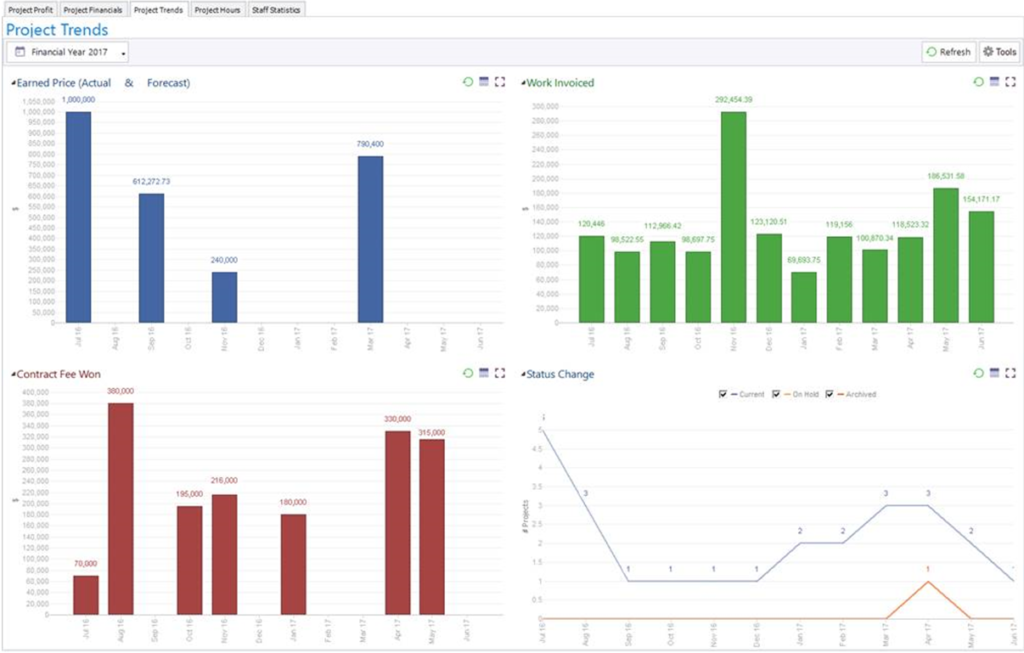
Project Trends
Trend graphs are a powerful way to see how your whole business is performing.
Earned Value shows the Price of all Stages where the forecast finish date is within the month.
Work Invoiced is the amount Invoiced where the Invoice Date is within the month.
Contract Fee Won is the total of all Contract Fees where the Status was changed to Current during the month.
Status Change is a count of Projects that change status within the month, giving an indication of throughput.
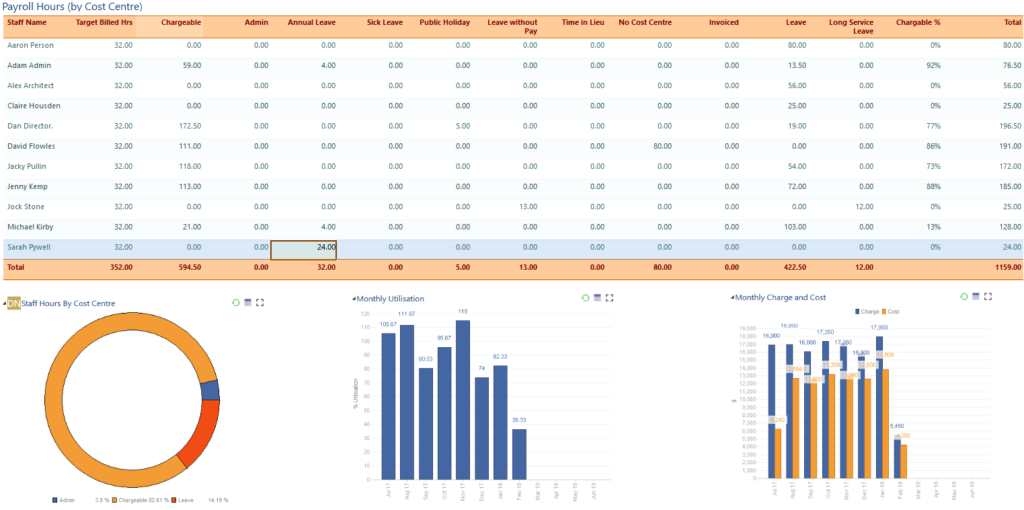
Staff Statistics
All staff are shown in the top table with the timesheet hours for each Cost Centre. For the selected staff member the donut shows the hours by %; the Monthly Utilisation shows total hours booked to project work; and the Monthly Charge and Cost indicates the staffs profitability.