
eTrack includes powerful, yet simple to use, tools to analyse your data, directly on the screen. No long list of predefined reports you don’t know which does what. Simply click a tab, click Analyse, and you can apply your own grouping, filters, columns, collapsed summaries and date ranges. Then save it as a your own personal ‘View’ for future use.
Many of the Tabs you use every day such as My Tasks, Participants, Plans, Booked Time, Goals and Compliance Registers can be analysed.
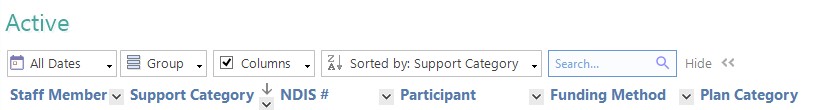
To get started, select a tab and click: Analyse >>
-
- Multi-Group: Click the Group button and select a column to group by. You can group by multiple columns such as ‘Time booked by each Staff Member by each Participant’.
- Collapse/Expand: Click Collapse to hide the lowest level of a report such as the Date rows in a Time tab. Columns that can’t be added up are hidden leaving hours and dollar columns.
- Hide Columns: Click the Column button to hide columns, for example if not relevant or you are wanting to print across one page.
- Theme Colours: Choose a coloured theme you like.
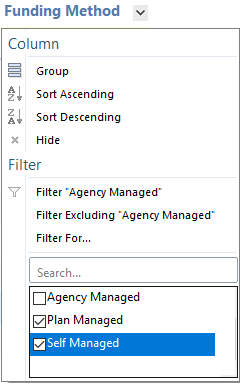
- Advanced Filters: click the at the top of a column and tick the data values you wish to include. For example, only Plan and Self-Managed Funding Methods (you could only filter by one before!).
-
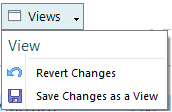
- Save View. When you are finished select the View button to save your selections with a name of your choice, or to Revert to the original tab.
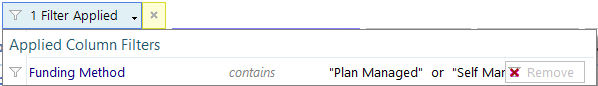
- Click the tiny v in the buttons to view and delete filters or groups.
-
- Click X to clear them all.
- To reset all your data after Analysing, click View and select ‘Revert Changes’
- Refresh
 will update data without clearing your analysis.
- Click X to clear them all.
And there is more to come…
- Security to share Views: Ability to share your saved views with other staff or staff in a security group. Currently Views are personal.
- Master Report: All Participants data in one report, including last Case Note and last contact date.
- Alert and Health Checks: Conditional filtering to provide warnings such as ‘No Contact for > a month” or “Task Due > Today – a week”.
- Graphs: Creating a View that is a Graph.
- Coloured cells: Colour cells based on conditionally filtering.
Random Thought…
Further to the Newsletter on Task Management, a great way to have a profound effect on your efficiency is to make a habit of continuously making small changes. For example….
- A second monitor really helps productivity, three is even better!
- Put your computer to sleep at the end of the day, don’t Shutdown, so you start off where you left off. Shut down once a week (or more often if performance degrades).
- Start the day by setting alarms 8 minutes before each scheduled meeting.
- Setup email so Draft emails go to your Inbox so you don’t forget them.
- Setup email to send every 15 minutes. Any changes you’ll likely think of within that time and can catch it before its sent.
Let us know what other features you would like to help analyse your data. [email protected]